Services
Information is the oil of the 21st century, and Data analytics is the combustion engine.
Data Management and Analysis
In data management, I am involved in the Extraction, transforming, harvesting, cleaning, and reshaping of data in such a way that will ensure easy analysis. I specialize in analyzing data. Results, trends, and recommendations are clearly presented in reports or tools. I use Excel, Power Bi, and Python for my analysis.
Data Visualisation
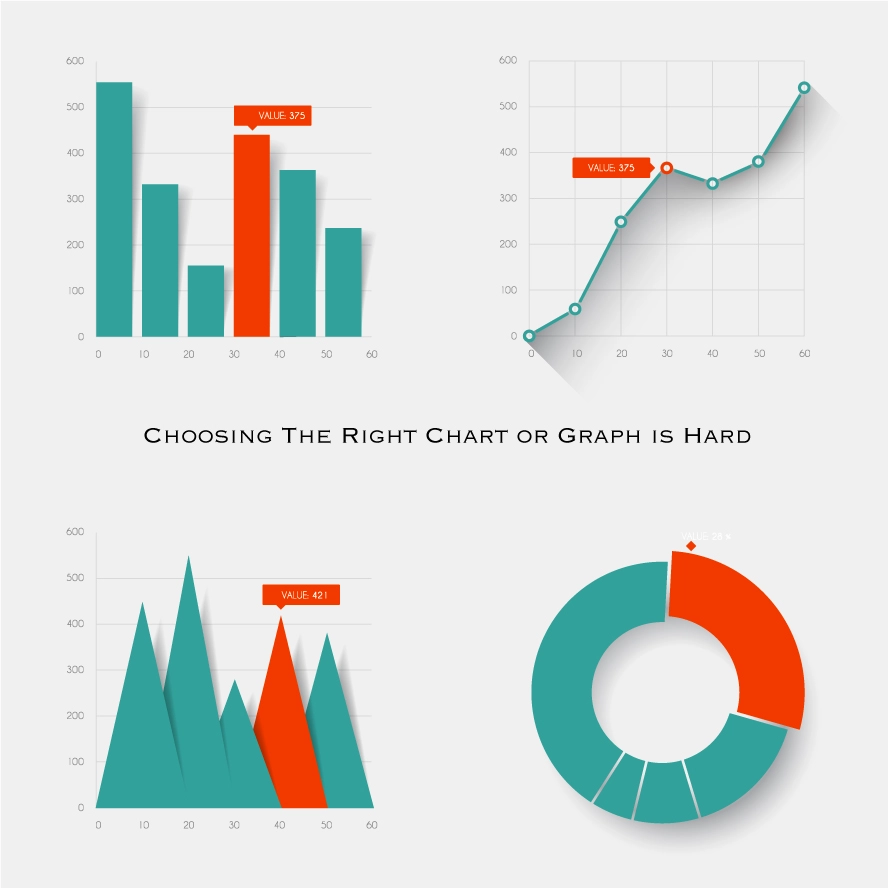
By creating visuals that contain static and interactive content and relatable data visuals and dashboards that will give insights that will be beneficial to the organisation, A picture says more than a thousand words. I love reading and writing stories, I believe they can be better told with eye-catching visuals. I also believe there are appropriate visuals for appropriate reports. For example, a pie chart should not have more than 3 or 4 categories is not advisable in my opinion. This is because people are better at comparing differing lengths than areas, also a bar chart is a better choice in many cases. I use Power BI, QlikView and Tableau for my data visualisations.


Infographics
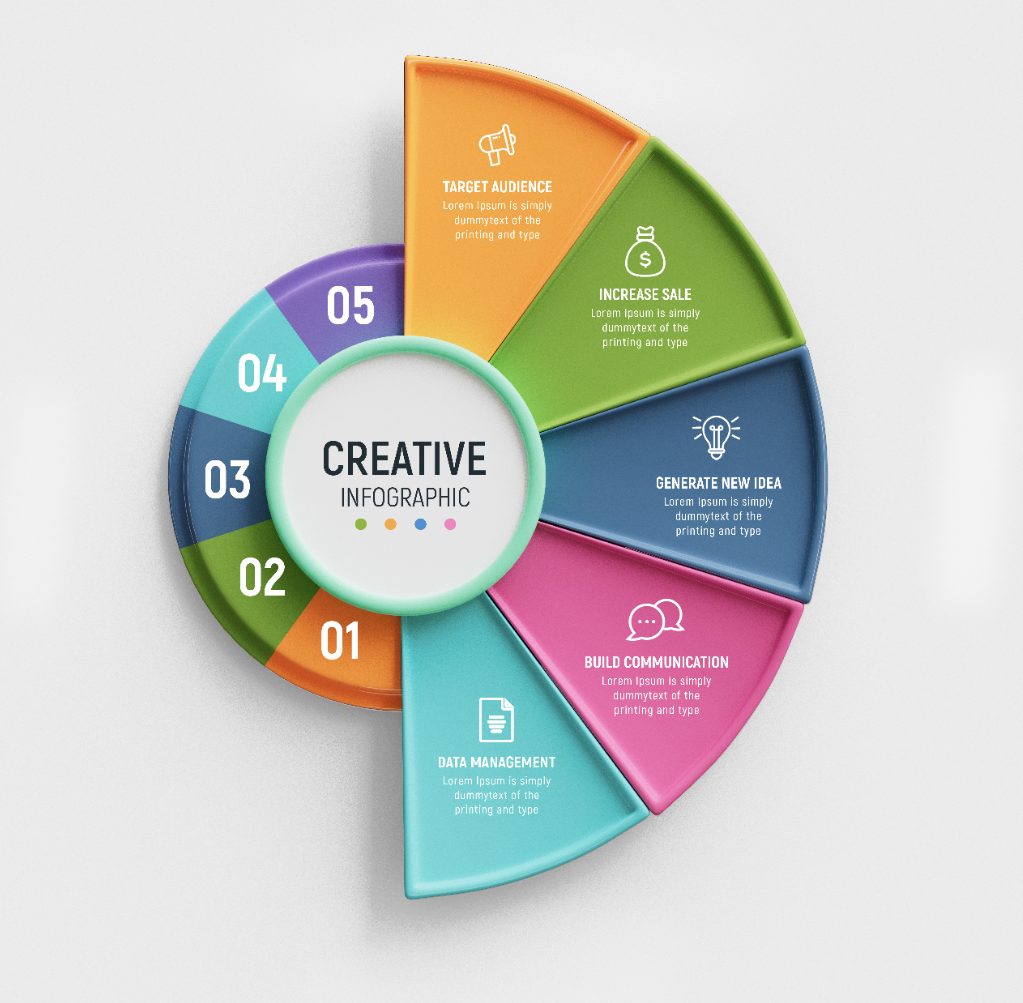
With infographics, I will Present your data with graphs, charts, and other visual elements to show patterns, trends, and other important information. Infographics can be used to explain complex processes, by using flowcharts, diagrams, and other visual aids to make this happen. When Infographics are used to compare different things, such as products, services, or even ideas, patterns are easily noticed. Most importantly, in addition to my love for telling stories, infographics can be used to create a narrative that engages the reader. Overall, infographics are a versatile tool that can be used in many different ways to communicate information effectively.
Dashboards
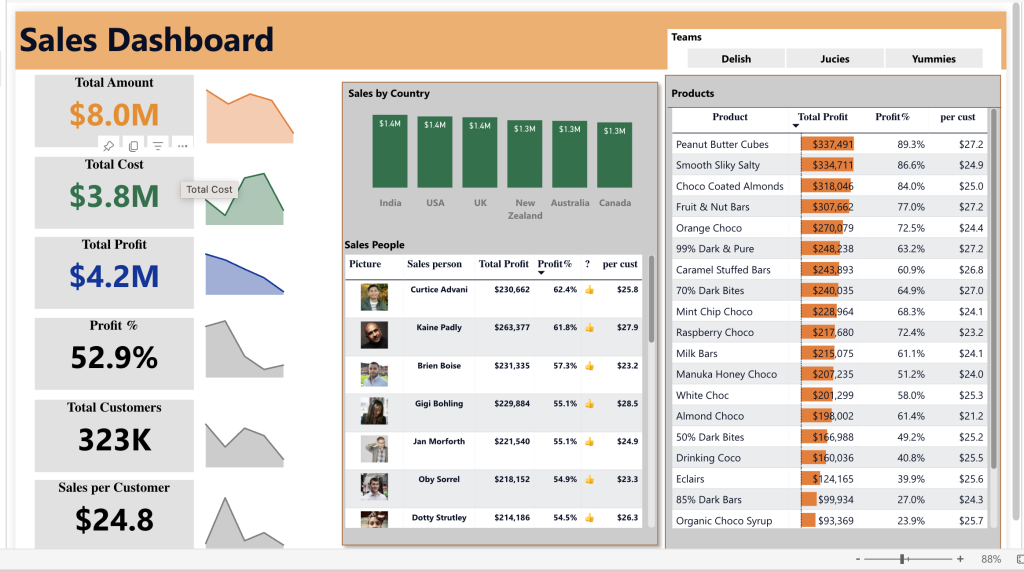
Dashboards show the most recent results in an interactive way. By clicking and drilling, you will examine trends and patterns yourself. Dashboard reports can be a powerful tool for communicating information to your clients in a clear and concise way. I have experience in using Google Data Studio, Tableau, and Power BI. I present a customized dashboard tailored to the unique needs of every client because every client is different. Overall, dashboard reports can be a valuable tool for building stronger relationships with your clients and helping them achieve their goals. By following these steps, you can create effective dashboard reports that help your clients understand their data and make better decisions.

Join our mailing list and subscribe!
